|
Simply the best
- Easy does it
Already the version 7.5, improved analysis engine has been used. The Metastock add-on targets simplicity, high quality wave count and ease of use. In a straightforward way, no hassle, you can select a chart and have it analyzed for the most preferred Elliott Wave count. It can be downloaded from the internet with a few clicks and no additional protection devices nor manuals need to be shipped. Ofcourse you need to have Metastock installed first.
- features-labeling of waves
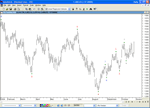
The engine analyzes the waves using the Classic rules of the Elliott Wave as defined by Prechter in his book "Elliott Wave theory". The best, preferred count will be shown on the price data of a Metastock chart, after ELWAVE has researched 1000's of combinations. See the example below:

Click to enlarge
Example: NASDAQ-Chart, analyzed on October 27th 2004 (Close 1.480).
- features-Expert Advisor
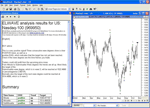
In addition to the first step, labeling the waves in the chart, you can ask the Expert Advisor for a crystal clear interpretation of the analysis. This will be explained in plain natural language, now avaialble in English, German and Dutch. First a conclusion will be presented with below a more detailed explanation. See the example below:

Click to enlarge
Example: NASDAQ-Chart with Expert Commentary, analyzed on October 27th 2004 (Close 1.480), showing 3 consecutive uptrends, which gives a clear BUY advice with price-targets of 1522 (short-term) to 1538 (medium term).
- features-Summary Inspector
Additional to the Expert Advisor the Summary Inspector is shown in the same window as the Expert. It clearly shows the consecutive wave degrees or patterns in patterns and most importantly, if every wave degree supports the same price direction. One of the nice things it includes is its clear targets for every wave degree, which are based on Fibonacci. This is the most certain, high probability target, which will be reached most of the time. Please see chart above at the bottom of the left window.
But what's the difference?
Here's a comparison table of the features of ELWAVE stand-alone vs. ELWAVE Add-on for MetaStock
| Feature |
ELWAVE stand-alone |
ELWAVE for MetaStock |
|
Support for daily charts |
YES |
YES |
|
Support for intraday charts /
realtime through DDE |
YES (req. Intraday module) |
NO |
Support for realtime charts
(Fully integrated link to eSignal, Quote.com, RealTick, Tenfore, Tai-Pan and more) |
YES (req. UDS ServerFeed module) |
NO |
| Summary (multi-timeframe targets, trends) |
YES (req. Trading Signals module) |
YES |
| Target Zones |
YES (req. Trading Signals module) |
NO |
| Scanning (Explorer) |
YES (req. Scanning module ) |
NO |
| Expert Commentary |
YES (req. Expert Advisor module) |
YES |
This release of ELWAVE 7.7 (BETA) contains the following new features and enhancements:
- Optimized time frame analysis
You can now directly tell ELWAVE what time frame to analyze. Just click and hold the 'Go Analyze' button for more than one second and select the time frame from the drowdown list that you would like to analyze. This is a major new feature which makes it possible to adjust the analysis results from ELWAVE such that they are always directly relevant to the way and time frame that you trade.
It is possible that there is not sufficient historical data (loaded) to analyze the currently active/selected (larger) time frame, resulting in an error message. When this happens, you can either: 1) Load more data, if available, or 2) analyze a smaller time frame.
It is also possible that the data that is loaded does not provide sufficient detail for the currently selected (smaller) time frame. In this case either 1) Load more detailed data (e.g. 1 min instead of 5 min), or 2) analyze a higher time frame
The Batch Processor also supports the new optimized time frame analysis. There is a seperate setting for the time frame to analyse in the Batch Processor.
- Added support for IQFeed®
You can now open charts from IQFeed® directly by simply entering the symbol or using the Search button in the Select Symbol window. To load a chart from IQFeed®, select 'Chart|New Chart...' and select IQFeed in the Provider or Files of Type field. Your charts will be updated in real time automatically.
This feature required the UDS ServerFeed module.
- Added support for Yahoo end-of-day downloadable historical data ASCII format (table.csv)
To import Yahoo historical data, select 'Chart|New chart…'. Choose ASCII in the 'Provider' or "Files of Type' field. Select 'DD-MM-YYYY' as the Date Format. Make sure that 'Most recent date in first line is checked. This feature does not require the UDS ServerFeed module.
- Added support for Yahoo!®
You can now open charts from Yahoo! historical data directly by simly entering the symbol in the Select Symbol window. To load a chart from Yahoo!, select 'Chart|New Chart...' and select Yahoo! in the Provider or Files of Type field.
Yahoo!® is currently a free end-of-day dataservice provided by Yahoo!. As with any other data provider, Prognosis Software Development can take no responsibility whatsoever for content or the availability of this service. Yahoo specifically states the following: "All information provided "as is" for informational purposes only, not intended for trading purposes or advice. Neither Yahoo! nor any of independent providers is liable for any informational errors, incompleteness, or delays, or for any actions taken in reliance on information contained herein."
Please note that it is not allowed to redistribute data downloaded from the Yahoo website either through a regular web browser or through ELWAVE.
- Added support for tick charts from eSignal
It is now possible to open tick charts from eSignal. As per the requirements set forth by eSignal, this is limited to a maximum of 10 days.
- Improved support for Quote.com
Quote.com support now uses our new, easier to use interface. To use the new interface, sleect Quote.com QCharts as your provider instead of ote.com.
- Improved support for TC2000/TC2005
TC2000 and TC2005 now use our new and much easier to use interface. To use the new interface, select TC2000/TC2005 as your provider instead of TC2000.
- Batch Processor support for templates
Batch Processor now allows you to specify whether to open an existing .elw chart, a blank new chart or a new chart based on a specific template.
- Batch Processor in background
The Batch Processor can now run while you continue working with ELWAVE. THe Scan Inspector cannot be used while the Batch Processor is open.
- Select All function
New 'Select All' function to easily select and delete all chart objects such as manually placed wave labels, trend lines etc. Right click on the chart and select Select All from the popup menu.
- Automatic data error correction
Some Invalid OHLC data errors are now automatically corrected during import. This feature can be disabled if necessary by adding this lines to ELWAVE77.INI under the [ELWAVE] header: FixOHLC=0 Alternatively you may add this line to ELWAVE77.INI to generate a log of the corrections made in RLogApp. You can open RLogApp to view this log by double-clicking the Prognosis Icon in the system tray
- Fully automatic uninstall added
We no longer support Windows 95. Please do not try to install this version on Windows 95 systems |