auto-a[1]

Introductie Elwave

Deze nieuwe release van ELWAVE is niets minder dan een doorbraak in de geautomatiseerde Elliott Wave analyse. De automatische analyse, die het hart vormt van deze software en reeds lang wereldwijde faam geniet wegens zijn ongeevenaarde kracht, heeft een ongekende verbetering ondergaan, die gebaseerd is op onze onderzoeksinspanningen van de laatste jaren.Het resultaat is verbluffend: analyses worden gemaakt met een nog grotere nauwkeurigheid en consistentie dan voorheen al het geval was en zijn nog even objectief en snel voltooid als eerst. Tijdframes en golfgroottes zijn nu volledig consistent met hetgeen gebruikelijk is in de gangbare literatuur over de Elliott Wave theorie. Door deze verhoogde consistentie zijn signalen op meerdere tijdframes eenvoudiger te onderscheiden en te duiden, zodat u met gemak kunt handelen op een specifieke beleggingshorizon.

Enkele andere nieuwe eigenschappen zijn de (optioneel) volledig naadloos geintegreerde ondersteuning voor Tenfore QuoteSpeed/SatQuote . Indien u Quotespeed via internet heeft, krijgt u volledig automatisch de tickdata van de Tenfore server in Frankfurt in een oogwenk in Elwave! (Data-ondemand).Ondersteuning voor data van RealTick is verder verbeterd en vanaf nu kunt u ook RealTick data gebruiken voor Europese beurzen. RealTick data for non-US markets Voor diegenen die (tevens) gebruik maken van WallStreet is tevens zeer interessant de (optionele) naadloze koppeling aan de data van WallStreet voor zowel dagkoersen als realtime. Uiteraad worden ook nog steeds de andere datafeeds ondersteund zoals ActivePlus, EuroBench, Reuters, interactivebrokers en vele anderen.
Verder is de gebruikersinterface verbeterd en vereenvoudigd, onder andere door:

  • Snelle Symboolinvoer
    Maakt het mogelijk direct iedere grafiek te openen door eenvoudig het symbool in te tikken of te selecteren, zonder hiervoor zelfs maar de muis te hoeven gebruiken
  • Automatisch bestandsonderhoud
  • Automatische analyse bij het openen van een nieuwe grafiek
  • Nieuwe knoppenbalk voor de meest gebruikte functies

Regular service-contract

  • Een jaar lang alle update gratis en bovendien onbeperkt email support
  • 25% korting op nieuw uitgegeven modules voor de software

Premium Service-contract

  • Een jaar lang alle update gratis en bovendien onbeperkt email support
  • 40% op nieuwe modules
  • Tweede exemplaar van de software voor een eenmalig bedrag van EUR 119 incl. btw.

Service contracten worden automatisch verlengd aan het eind van ieder kalenderjaar (tenzij opgezegd voor 1 december van dat jaar) zodat u automatisch weer een jaar lang in aanmerking komt voor gratis updates en de andere genoemde voordelen.

 Lees verder

Review version 7.1 Stocks and Commodities 2004


ELWAVE Screenshot


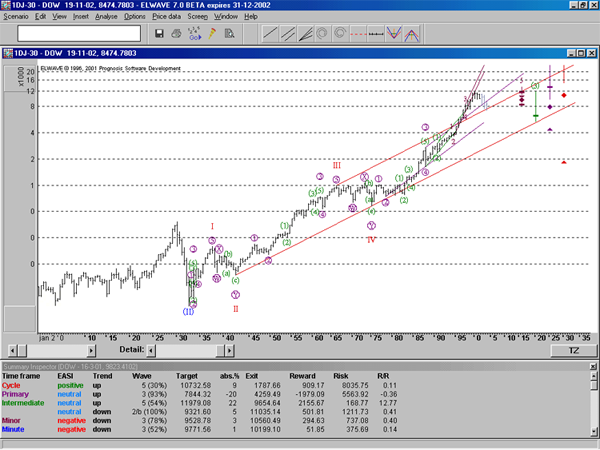
Below you will find an explanation and a screenshot of ELWAVE which shows the results of the analysis. This is an analysis of the Dow Jones as of November 14th, 2002. Please note that the data file starts in 1900(!), therefore very long term patterns have been analysed.


It is simple!

In the window at the bottom of the chart you find the wave degrees or time frames listed in the Summary Inspector window, from the larger time frames to the smallest time frames. The largest time frame is at the top called "CYCLE" which EASI (target indicator) is positive and trend is up. On the same line you will find other information with regard to this wave degree, but the most important news is that it has a very positive reading.
At the lowest position in this window you will find " Minute" time frame which also shows a positive reading.

With one glance you will notice that the chart above, which is a very long term chart of the Dow Jones from November 14th 2002, has a positive outlook. It will get even more positive if the Intemediate and the Primary time frames turn to positive as well!

It looks totally different when the outlook is bearish. The software will tell you without any hesitation. Take a look at the example below, which display an analysis of March 16, 2002 when the Dow started to decline more and more...Now the smallest time frames are NEGATIVE!

This is very much correct looking at the decline that happened thereafter
You can test the outcome in ELWAVE for yourself for any period you like and for any time frame you like to trade.

For example, if you use 3 months of intraday data, ELWAVE will analyse very short time frames, which perfectly fit day traders.


Forecasting an UP TREND

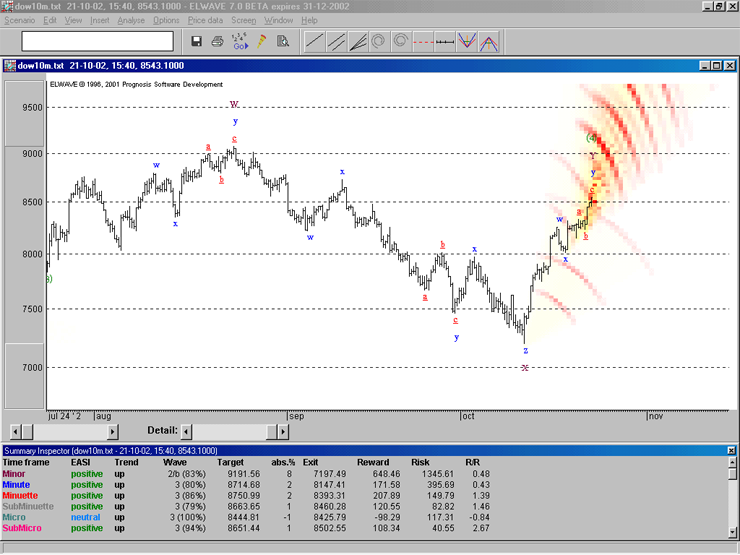
Look at the analysis below.
ELWAVE has analysed the smallest patterns in patterns. All trends are POSITIVE, forecasting the further up trend that made the Dow reach 9000 later. In this case 6 time frames show an uptrend, a very strong signal. In practice however, it suffices when 2 or 3 time frames show uptrends, but the more trends are up the stronger the signal.
 

Forecasting an DOWN TREND

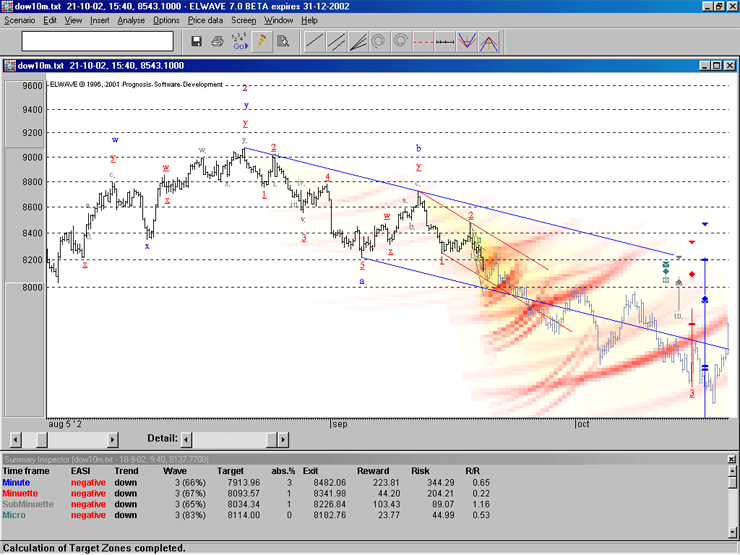
Now look at the picture as of September 18th, when the decline was only just beginning...Look at the Summary Inspector: all time frames show NEGATIVE and a down trend! The greyed out data is not part of the analysis, it shows the actual movement of the stock after the analysis was made

A pleasure to use
!

  • More information

    ELWAVE's analysis is a true Elliott Wave model not just a momentum model and of superior quality. Objective, detailed and very fast analysis!

    It presents a crystal clear outlook in its Summary Inspector. Because of the power of this Summary it is no longer necessary to evaluate every alternative. Nevertheless you can still investigate every single wave count in everywave degree if you like.

    The most important indicators are supported. comes with all Elliott tools: channels, indicators, Fibonacci time and price targets, Golden spiral.

    Fibonacci analysis on time as well as price. Projects very specific targets, displaying a target range per alternative, while the "Target Zones" display targets as supported by every alternative.

    Trade simulator is included for manual simulation. Results of your trading strategy can be shown with a press on the button.

    Unequalled educational value! The Wave inspector gives complete information or summary on every pattern, which is unmatched

    You can define your own wave count and have ELWAVE analyse it or check it partially

    Testing trading strategies is now easy with the Trade simulator. Walk through the chart bar by bar, without knowing what the future brings and enter your trades easily. When you are finished ELWAVE will make a summary of the result. Every trade will be shown in the chart.

    We have developed a special proportion Fibonacci and swing filter,which groups waves of the same degree together. It will combine time and price lengths of waves and will recognize that a sharp wave 2 connects to a flat wave 4 that has very little retracement. This way ELWAVE will determine relevant multiple time frames by itself, where every wave degree represents a time frame.

    ELWAVE shows all Fibonacci time as well as price relationships of patterns in the Wave inspector, if they exist, and takes this into account when calculating scores

    Special logarithmic indicators for long term analysis

  • !
     <<